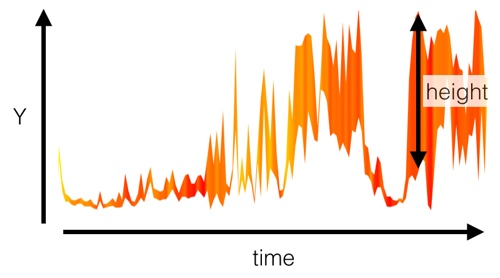
A Complex graph allows to display a graph with 3 set of data. You read this paper by Mikhail Malt & Emmanuel Jourdan to know how to use it to analyse timbre: Le « BStD » – Une représentation graphique de la brillance et de l’écart type spectral, comme possible représentation de l’évolution du timbre sonore.
To add a new complex graph, select button (bottom left):
![]()
Select With events and the template Complex graph.
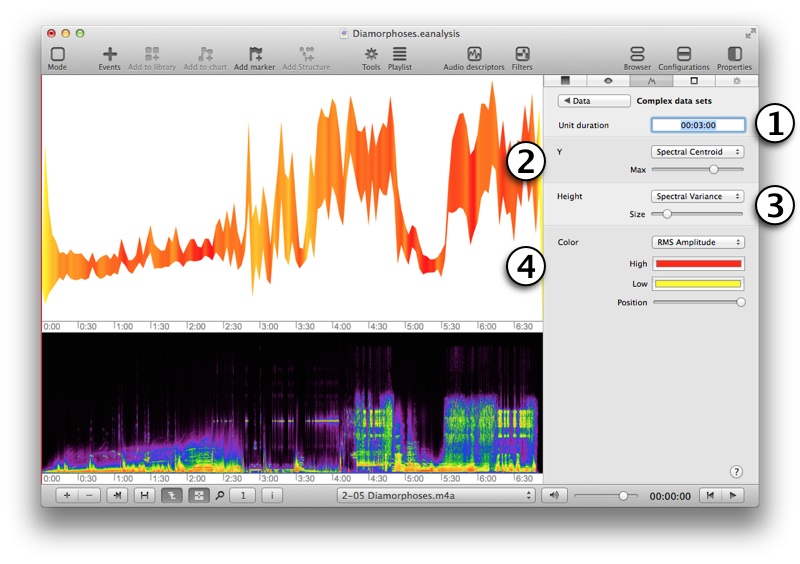
A complex graph is added at top. This view does not contain any graph, you have to import data and configure the view. Open property panel (Property toolbar button), select the third tab and the Edit button: