You use this view to display list of values. Each value must have time and decimal (or integer) value.
To add a new data view, select button (bottom left):
![]()
Select Data View and a template:
You need to compute audio descriptors or import data to display it inside this view. You can import data from txt or csv file.
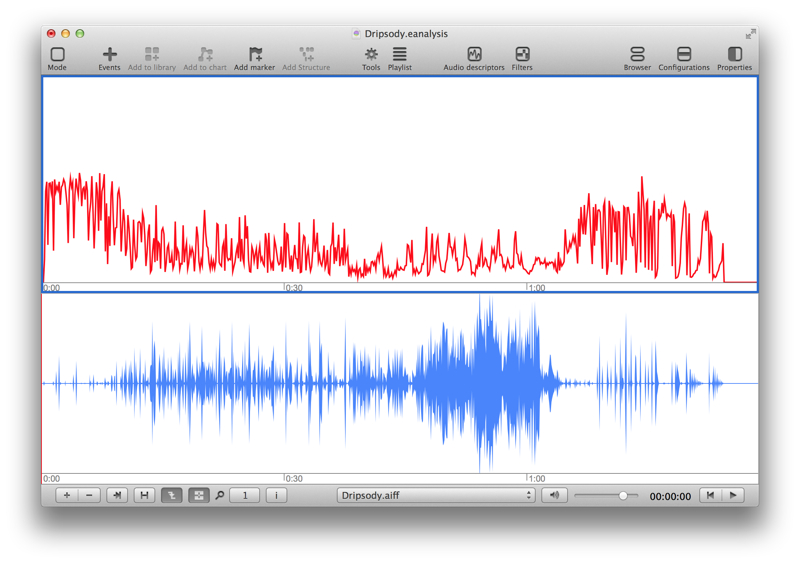
See: Audio descriptors.
First step (Sonic Visualiser): Create a file with Sonic Visualiser and create new layer from Vamp Plugin:
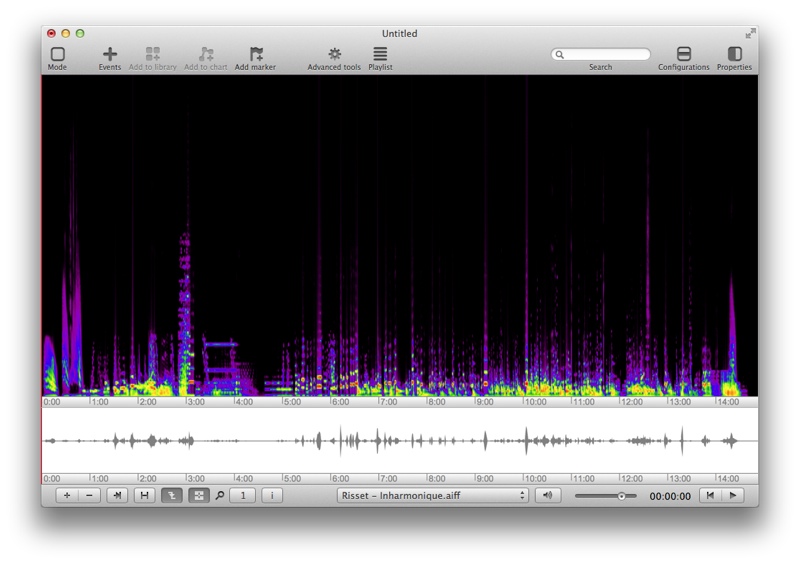
Second step (Sonic Visualiser): Export layer informations.
Third step (EAnalysis): Create an EAnalysis project, add a data view, and import data from txt file:
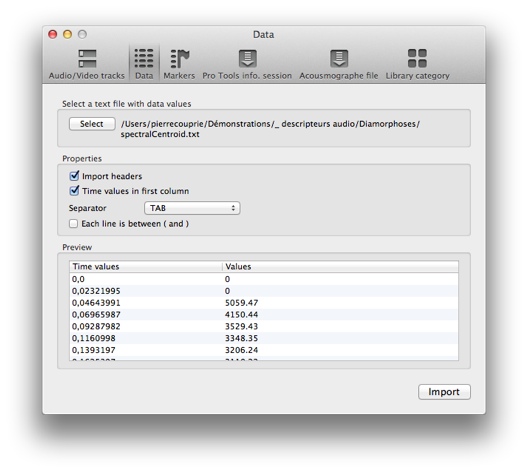
The data values is imported and is visible in second tab of properties:
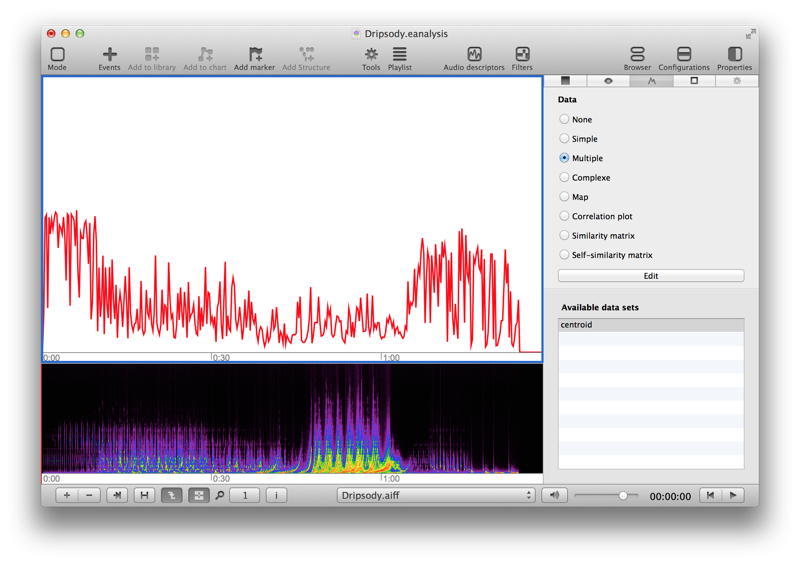
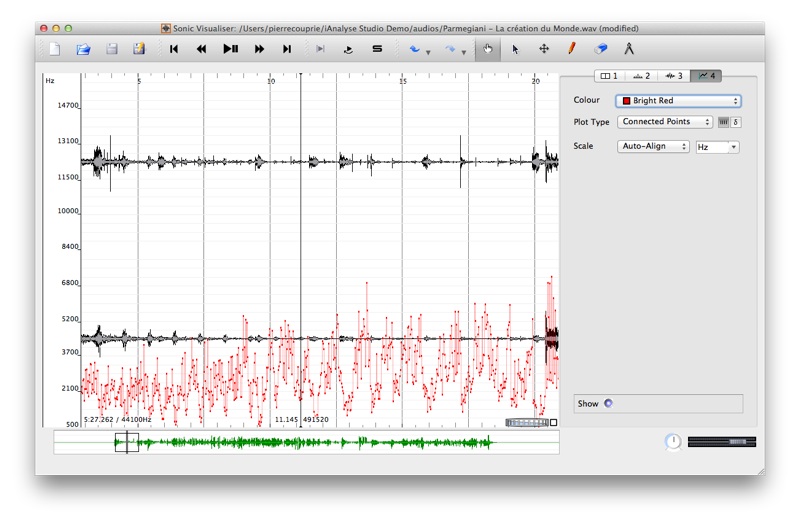
Select a type of visualization and Edit:
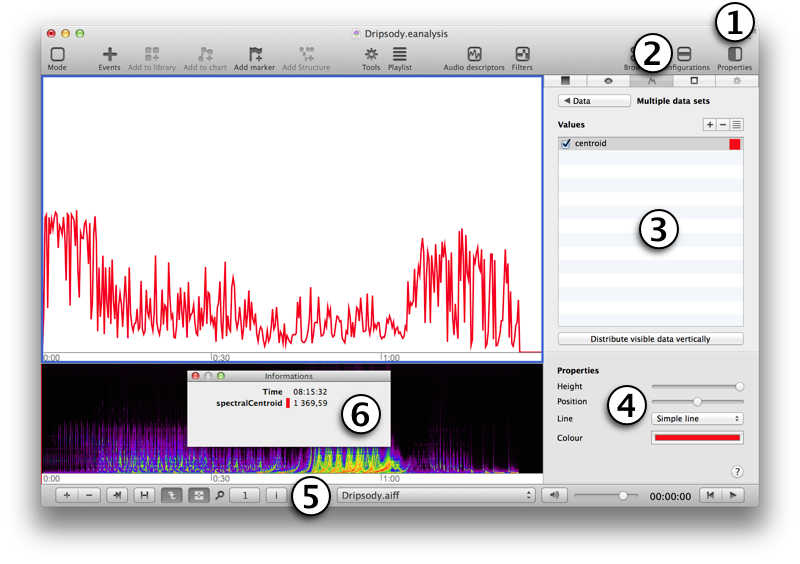
Select the view, open Properties panel, and select Advanced tab to change properties of curve:
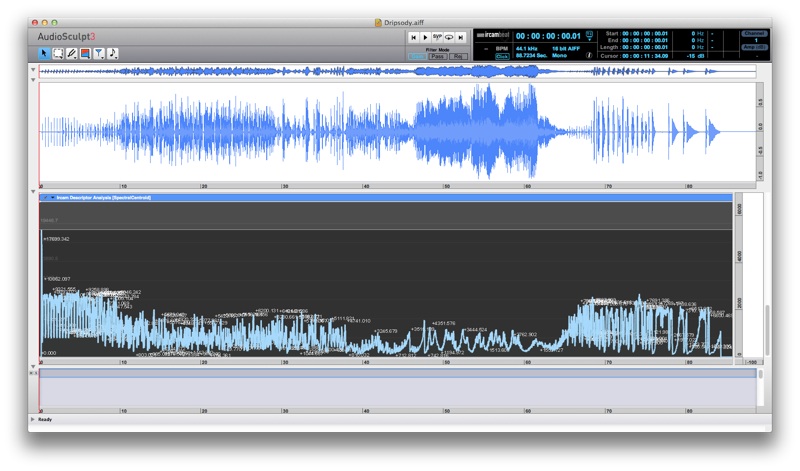
You can paste audio descriptor values from Audiosculpt (need 3.2.3 version or later).
From an Audiosculpt project with audio descriptors, select the panel with graph, use and :
In EAnalysis, use > > , and create a data view to visualize the graph: