A Correlation graph reveals correlation between two set of data. This graph is hierarchical. Read this paper to have more information on used algorithm: Hierarchical Correlation Plots
To add a new Correlation Graph view, select button (bottom left):
![]()
Select Data View and the template Correlation Graph.
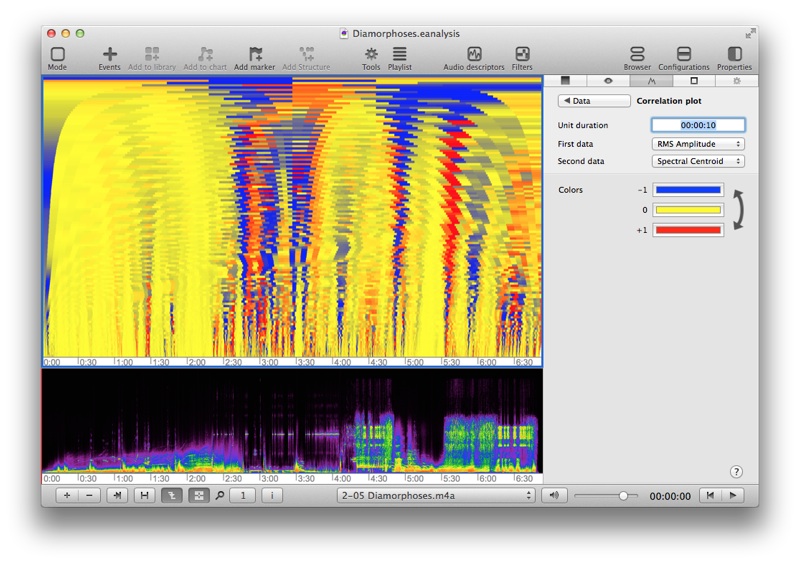
A Correlation view is added at top. This view does not contain any graph, you have to import data and configure the view. A correlation graph needs two set of data. Open property panel (Property toolbar button), select third tab and select Edit button: