Chart Data View
A Chart DataView allows to display graphs
To add a new Chart data view, select button (bottom left):

Select Data View and the template Chart.
A Chart data view is added at top. This view does not contain any graph, you have to import data and configure the view. Open property panel (Property toolbar button) and select Advanced tab:
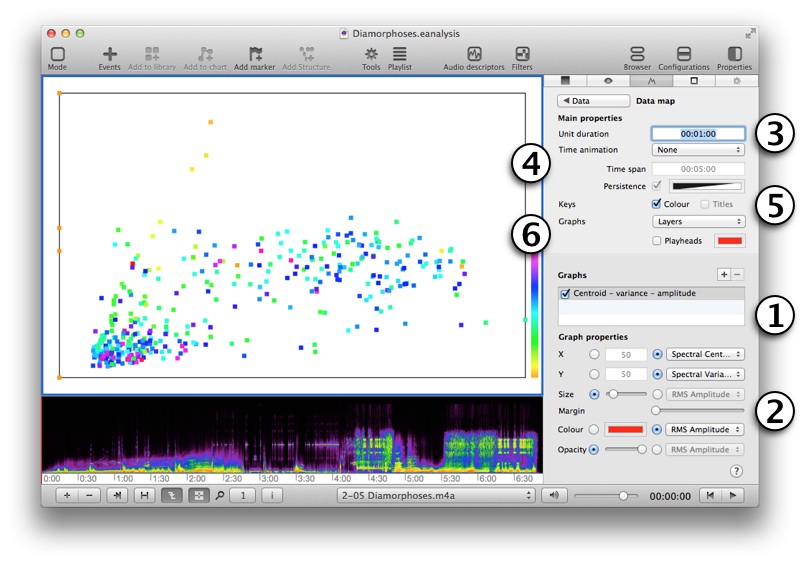
- Select + button to add a graph.
- Edit graphic properties of this graph: select a data for each properties.
- Unit duration contains the minimum unit duration in minutes:seconds:hundredth. A short duration needs a high CPU.
- Time animation:
- Type (|| represent the playhead):
- -|| show previous values before current time position.
- |--|| show previous value before current time position (according to time span).
- |-||-| show previous and next value before and after current time position (according to time span).
- Time span: duration of span for last two types.
- Persistence: when you select a specific tile span, you can view other values in a different colour.
- Key:
- Colour: show the gradient key color in bottom right.
- Titles: show title on the bottom of graph when you select side by side or 8 tracks (see next properties).
- Graphs:
- type:
- Layer superpose graphs.
- Side by side draw each graphs side by side.
- 8 tracks draw the 8 tracks in circle.
- Check Playhead to visualise the double playhead in animation.
Show different graphs
You can create one or several graphs:
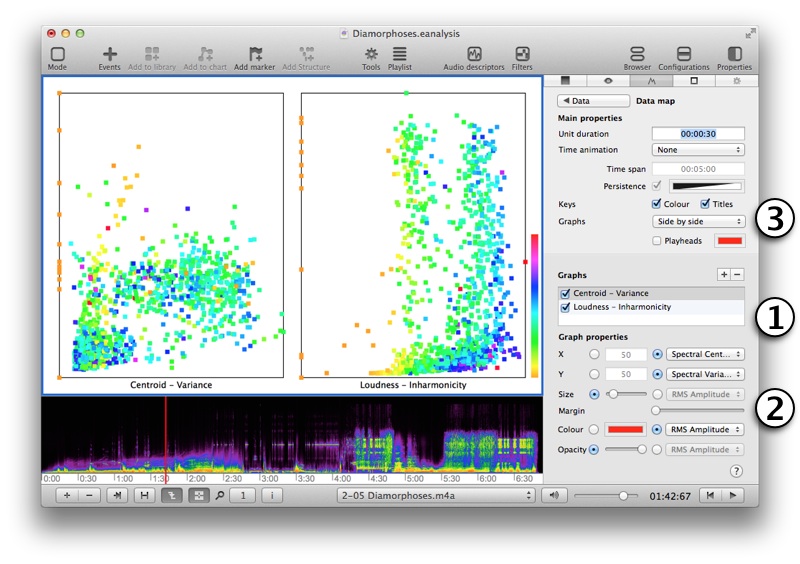
- Select + to add several graphs.
- Edit properties of each graphs.
- Select Layers to superpose the graphs or Side by side to have independent graphs (like in this example).
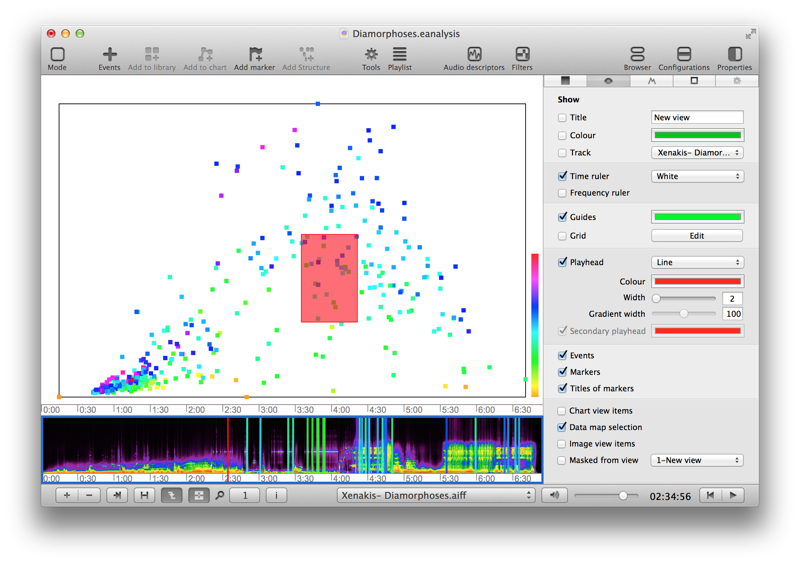
Show selection
You can select points by ALT + Shift + click and drag.
In time view properties, check Data map selection in the second tab to show position of selected points:
Use playback
Use CMD+click to play extract corresponding to a point.