Chart view
Choose chart view to create chart, table, or map with extracts of media files.
To add a new Chart view, click on button (bottom left):

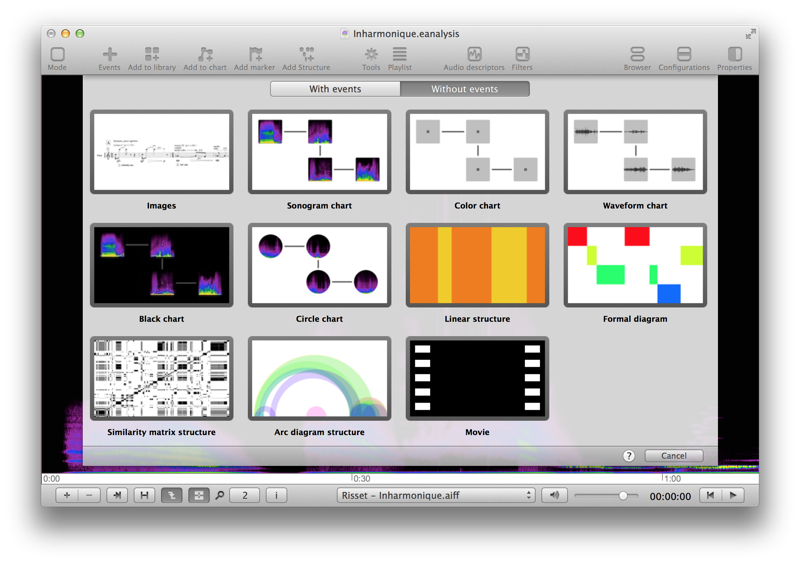
Select Without events and a chart template.
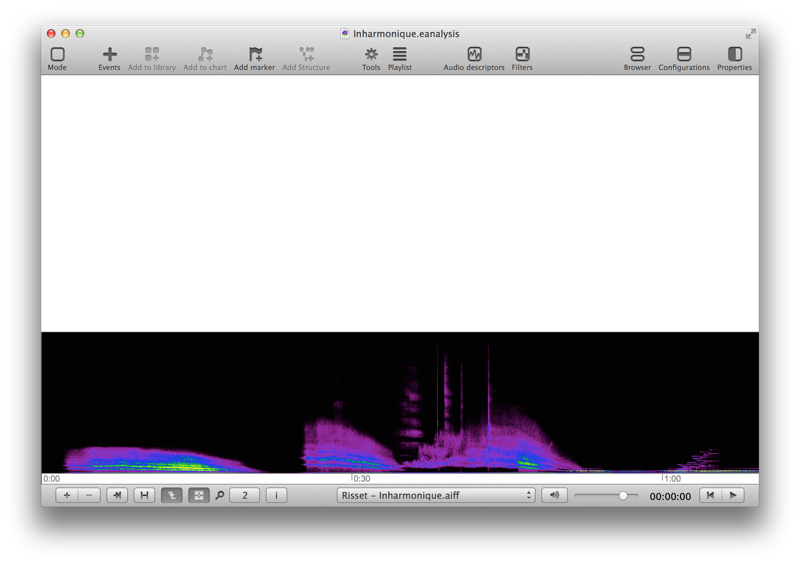
A new Chart view is added at top:
A map view and a sonogram view is better configuration to work with a chart view.
Add items to chart view
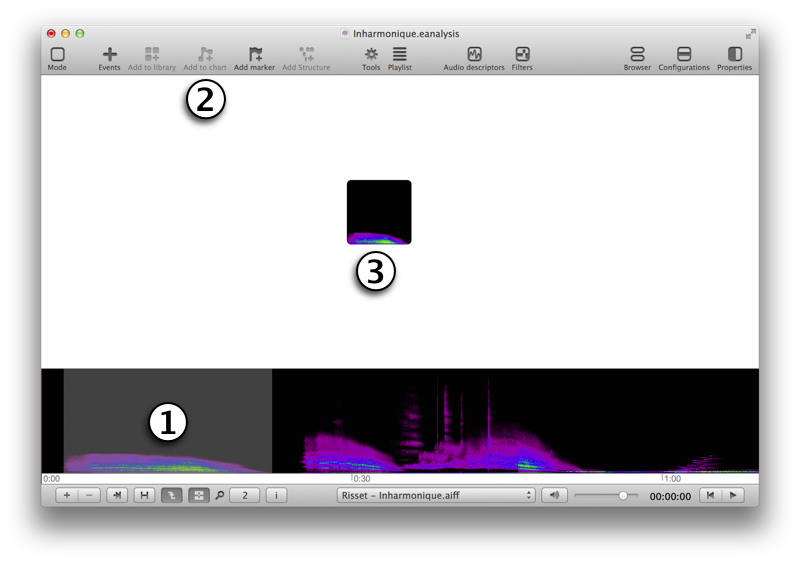
- Select an extract time view (ALT click and drag).
- Click on toolbar button Add to chart.
- Your selection is added the chart view.
To organise blocks, you can select one or several and move them.
Add links between blocks
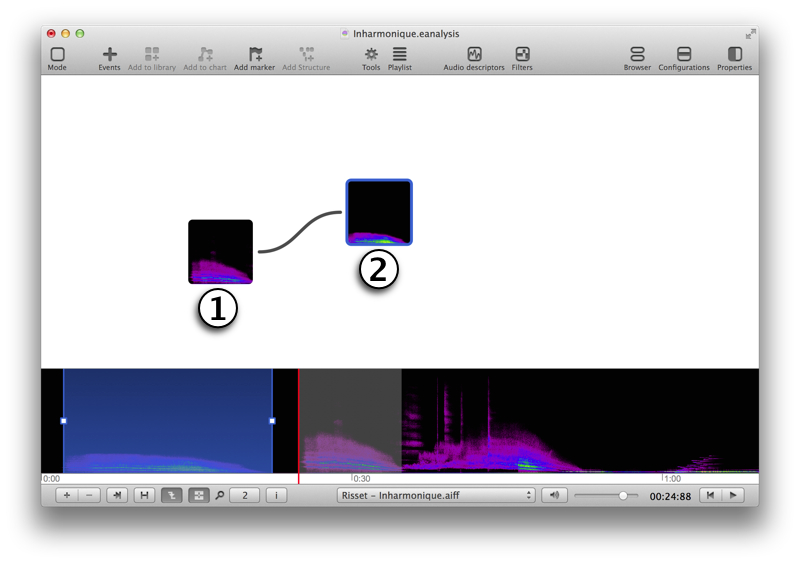
- ALT + click on starting block.
- Drag to a second block to create a link.
Display sonogram, waveform or colour inside blocks
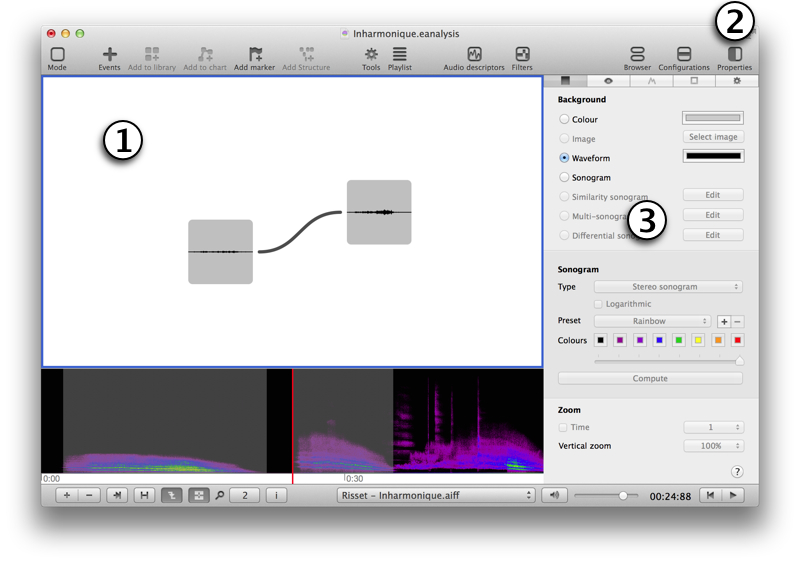
- Click in chart view to select it.
- Select button Properties of toolbar (top right)
- Change property of background.
Change other properties
Select last tab in panel of properties to edit more properties:
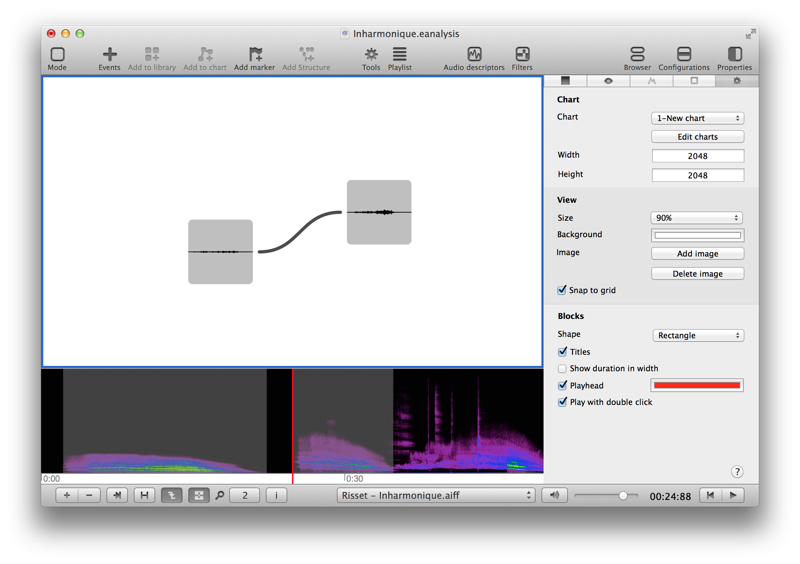
- Chart: select a chart and edit charts, you can create several charts in each projects.
- Width & Height: edit size of chart.
- View
- Size: size of view (and blocks).
- Background: colour of background.
- Image: add an image in background.
- Snap to grid blocks.
- Blocks
- Shape: rectangle or ellipse.
- Titles: show or hide titles of blocks.
- Show duration in width: width of blocks represents duration.
- Playhead: show playhead and edit its colour.
- Play with double click.
Change properties of blocks
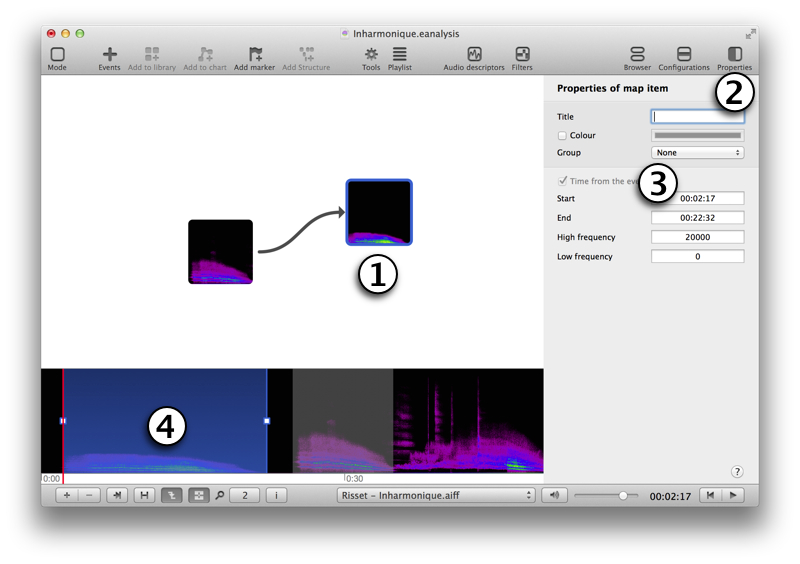
- Select an item.
- Click on the button Properties of toolbar (top right)
- Edit properties of block.
- Activate the Map view item property of the sonogram view to change time of map block.
Change properties of a link
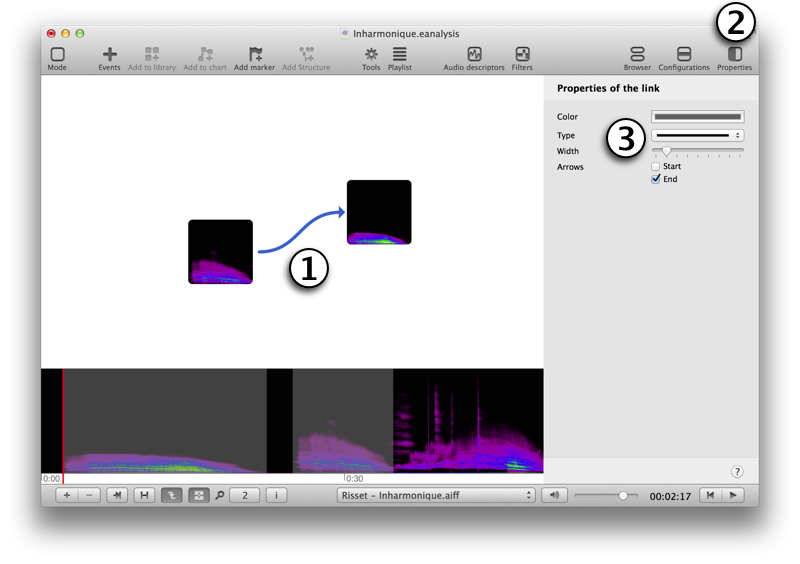
- Select a link.
- Select the button Properties of toolbar (top right)
- Change properties of link.