EAnalysis proposes three types of similarity matrix:
The matrix is not saved with the project, then EAnalysis needs to compute it when you launch the project. This step takes a while. Time computation depends to the duration of project and the unit duration parameter of matrix.
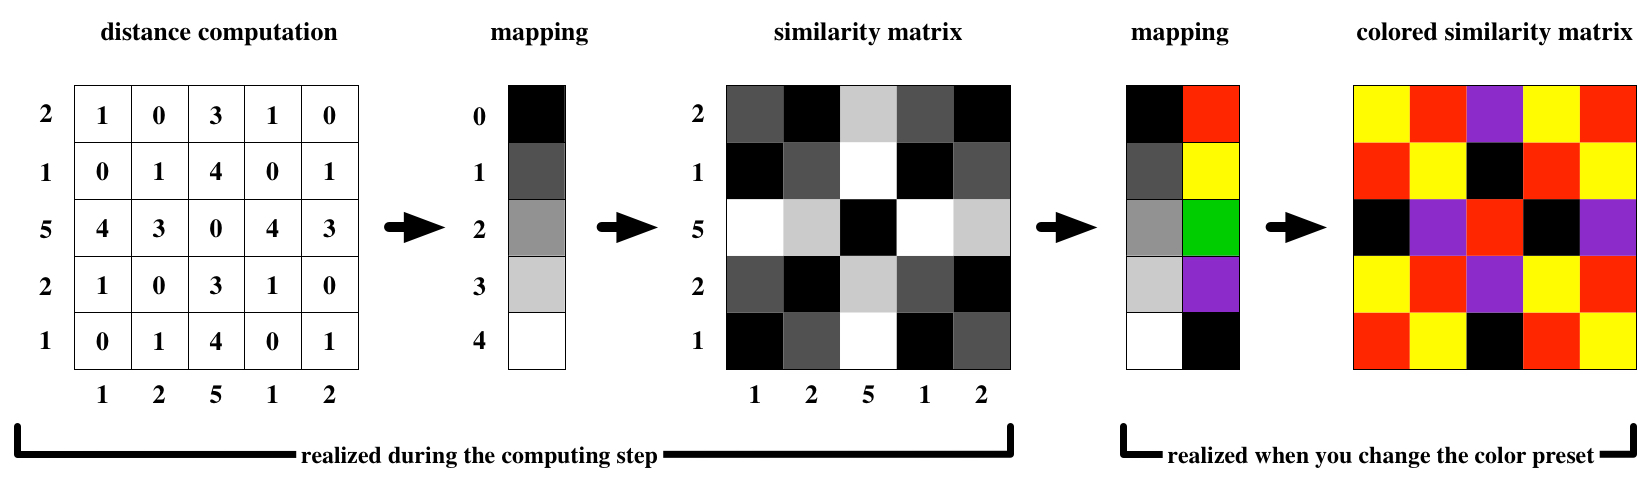
A similarity matrix represents the distance between two set of data. Both sets can be the same like in figure below (self-similarity). The distance results are mapped to color values to create the representation:
Step to compute the similarity matrix:
To have a matrix from sonogram, EAnalysis reduces the definition of sonogram image (unit duration and frequency bands parameters) and maps the color of each pixel to its numerical value (hue color). Then, EAnalysis compute the matrix like above.