Before use animated representations, you need to import audio or data files or compute audio descriptors.
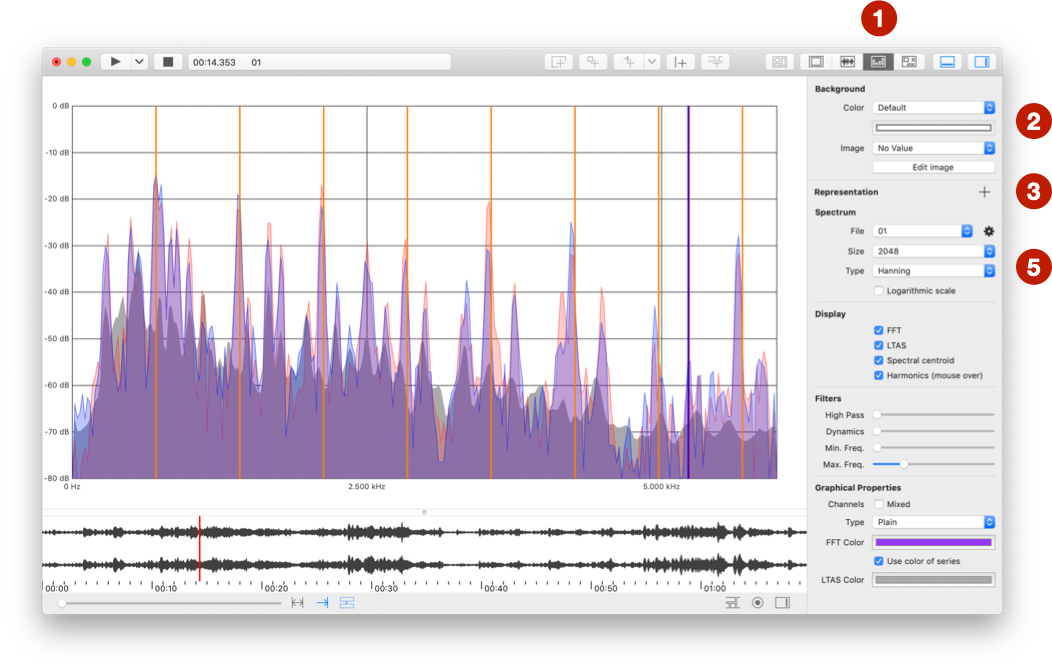
+ button.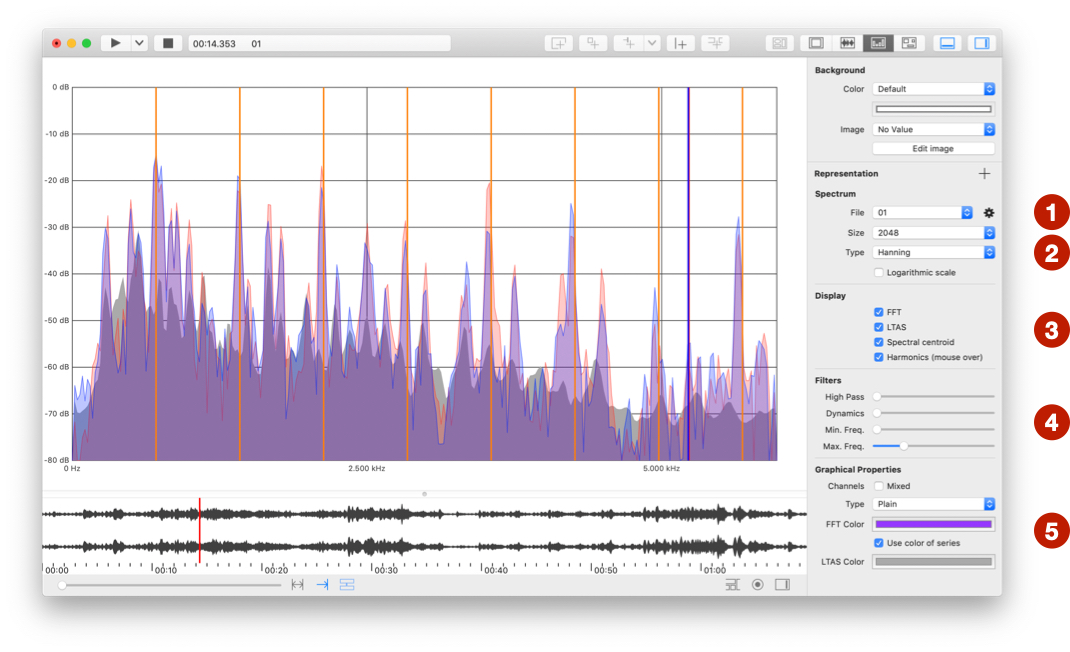
File to select an audio or video file (see also Advanced file menu at the bottom of representation page).size, type, and Logarithmic scale of computed window.FFT, LTAS, Spectral centroid, and Harmonics (first 25 harmonics). Computation of LTAS (Long-Term Average Spectrum drawn in background) can take several seconds, a progress wheel is visible during the computation. Harmonics are displayed when the mouse hovers the linear spectrum (it does not work on logarithmic spectrum).HP filter to remove low frequencies, Dyn. filter to remove low dynamic values, Min. Freq. to crop low frequencies, and Max. Freq.to crop high frequencies.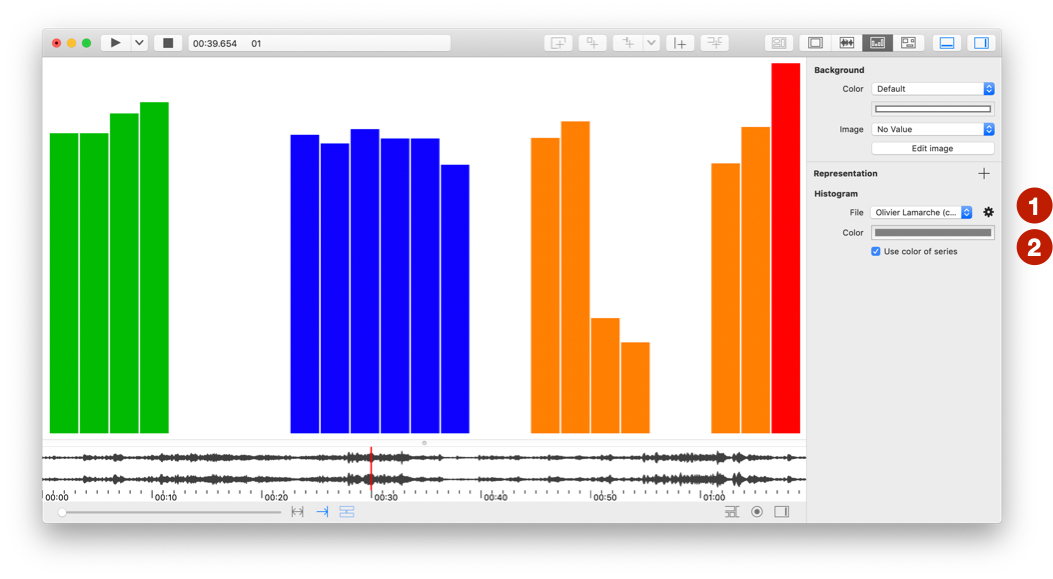
File to select a data file (see also Advanced file menu at the bottom of representation page).color.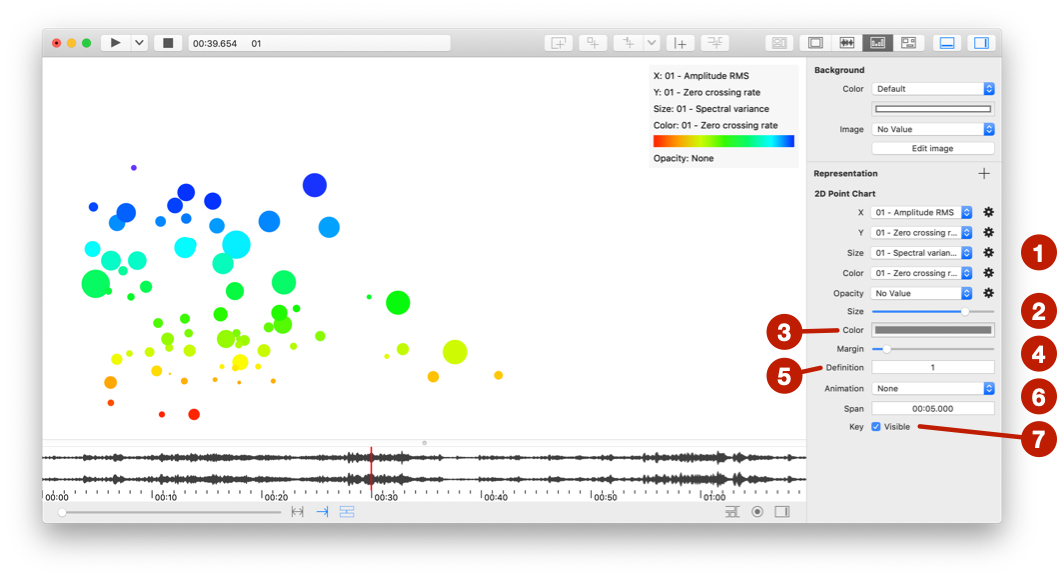
File to select 2 to 5 data file (see also Advanced file menu at the bottom of representation page).size.color.margin around the graph.Definition: 1 is the higher definition.Animation: Create time animation of 2D graph:span.span before the apparition of value and leave it visible during the half time spankey.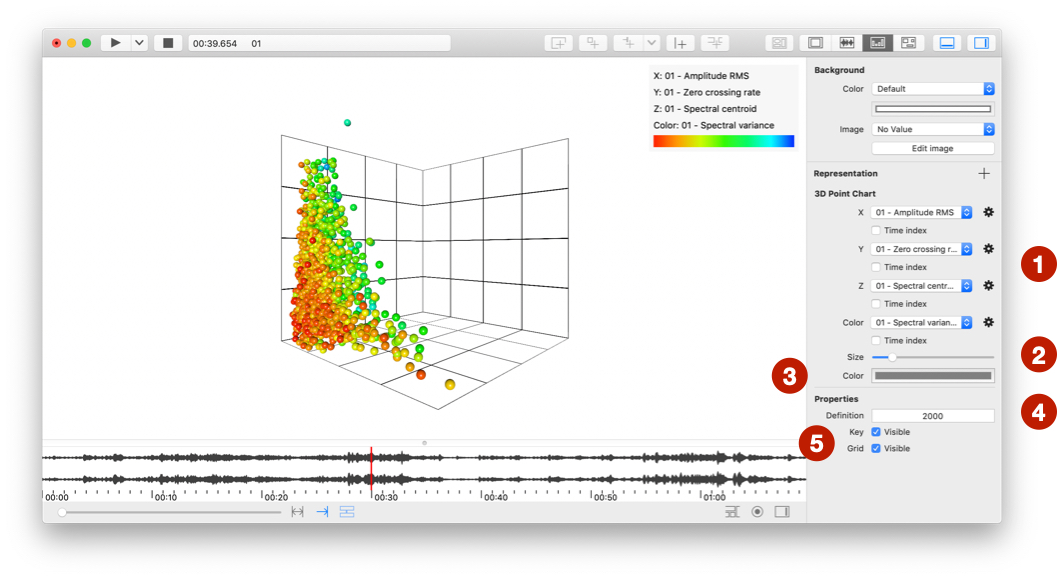
File to select a data file (see also Advanced file menu at the bottom of representation page).size.color.Definition: Number of visible values.key and the grid.