Graphical representation can be used in temporal view and in timeline. In temporal view, you can add several representations and manage them through layers. In timeline, you only can add one representation apart from waveform and sonogram.
To add a representation in temporal or timeline view:
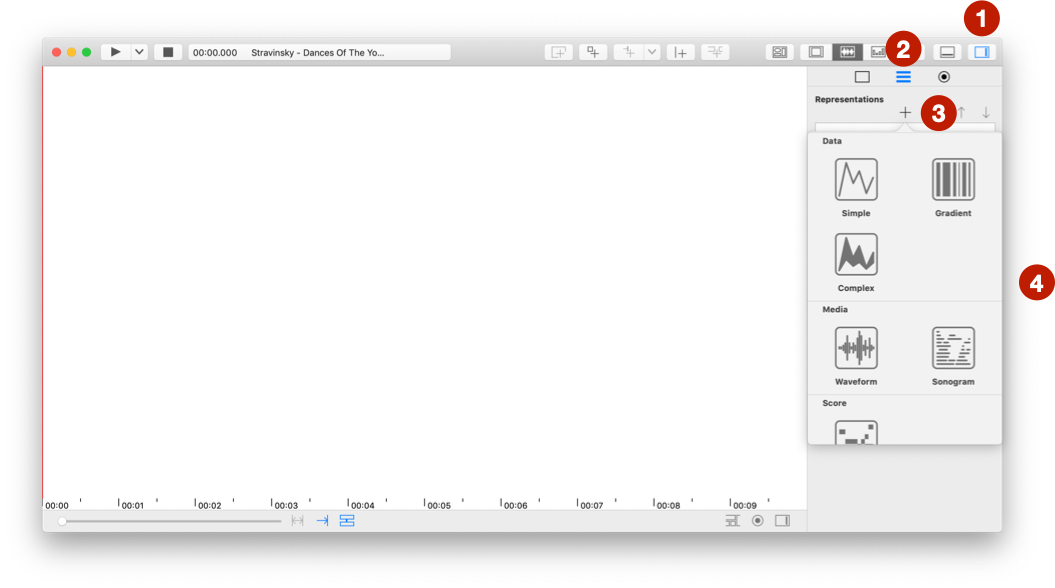
+ button.In timeline, you only can change opacity of representation. In temporal view, you have more settings:

Not all representations have vertical ruler. You also can show information to read values of representation.
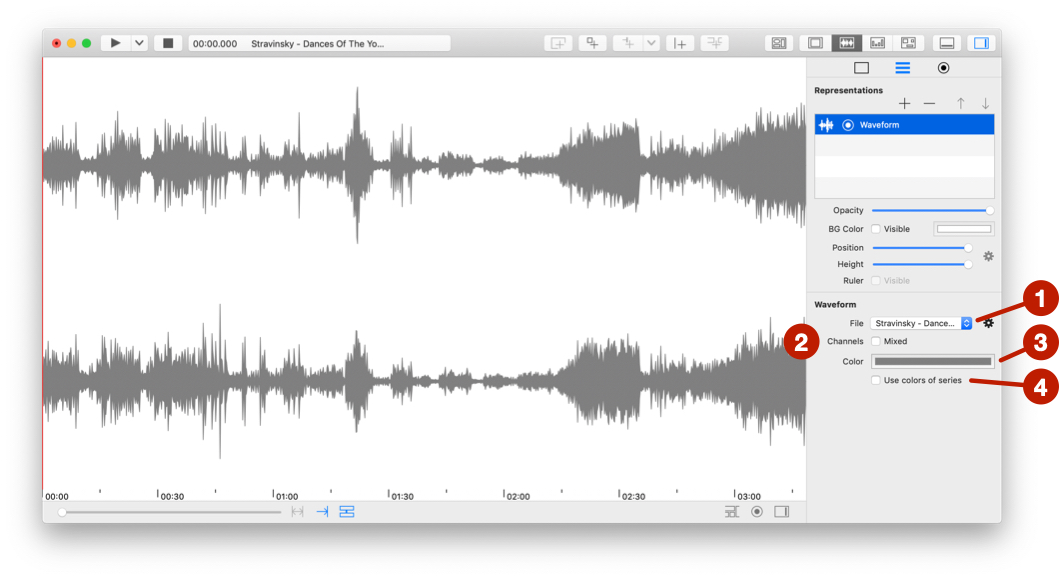
File to select an audio or video file.Channel: Display all channels or only the result of a mix. You can also specify visible channel (see Advanced file menu at the bottom of this page).Color: Change default color.Use color of series. These colors are specified in the advanced menu (see Advanced file menu at the bottom of this page).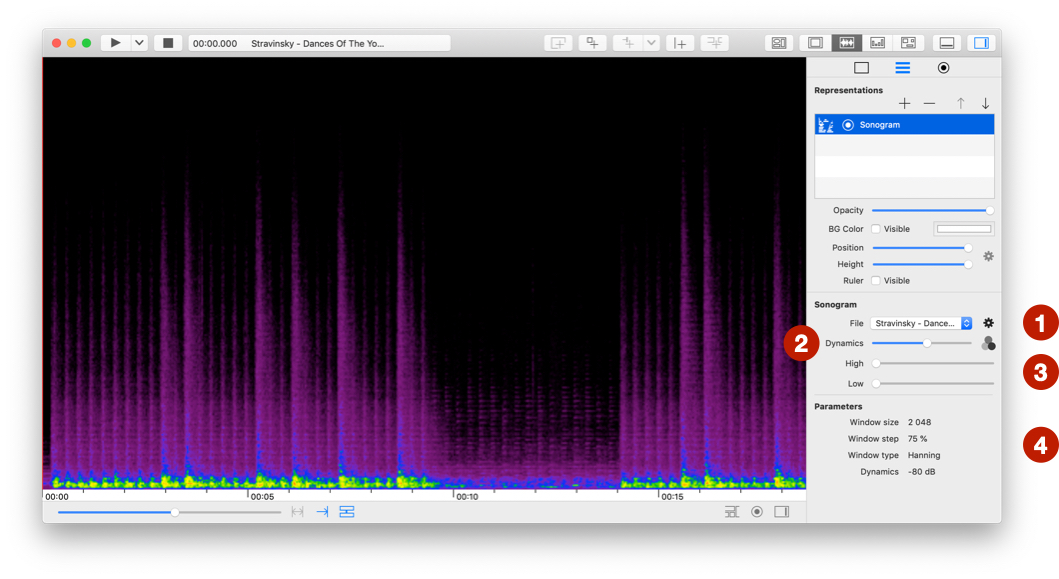
File to select an audio or video file (see also Advanced file menu at the bottom of this page).Dynamics: Change intensity of colors.Advanced colors at the bottom of this page.High and Low: Visual top and bottom position.Parameters: Settings used for computation.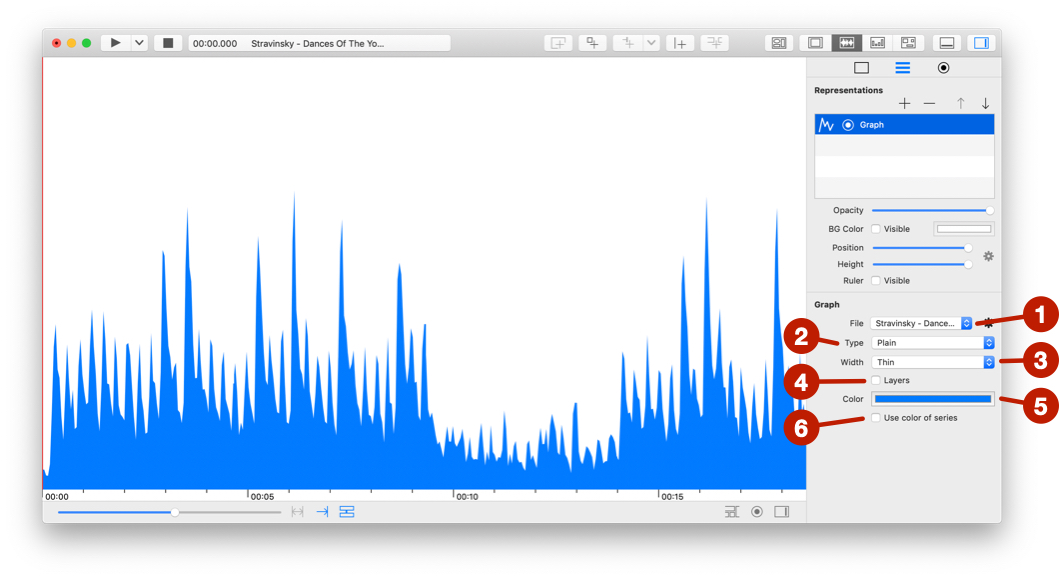
See Import data files for more details on the structure of data files.
File to select a data file (see also Advanced file menu at the bottom of this page).Type.Width: Width of line.layer: When data has several series, draw all of them layered.Color of graph.Use color of series. These colors are specified in the advanced menu (see Advanced file menu at the bottom of this page).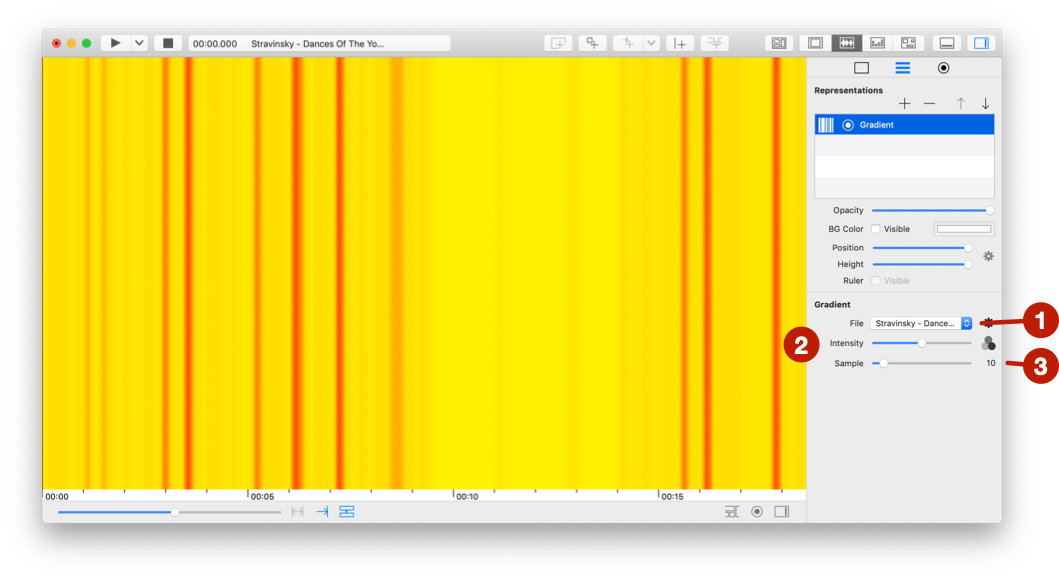
See Import data files for more details on the structure of data files.
File to select a data file (see also Advanced file menu at the bottom of this page).Intensity: Change intensity of colors.Advanced colors at the bottom of this page.Sample: Number of used colors.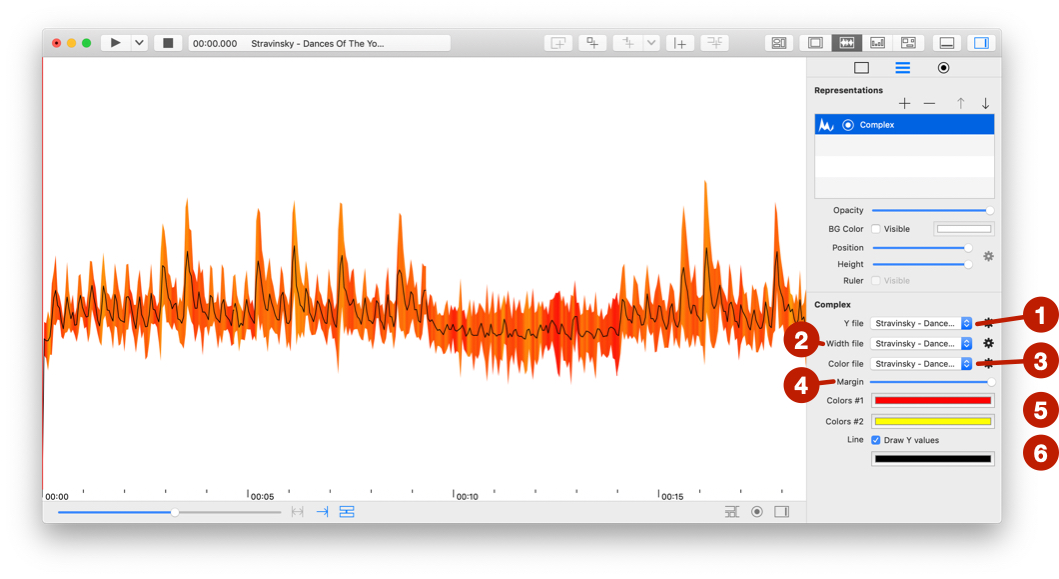
See Import data files for more details on the structure of data files.
Complex representation only uses the first serie of each data.
Y file to select a data file for Y value (see also Advanced file menu at the bottom of this page).Width file to select a data file for the width of line.Color file to select a data file for the color.Margin: Add a top and bottom margin.Color #1 and Color #12: Use with Color file parameter. The flow graph is drawn between these 2 colors.Draw Y value and Color is used to draw the exact value of Y.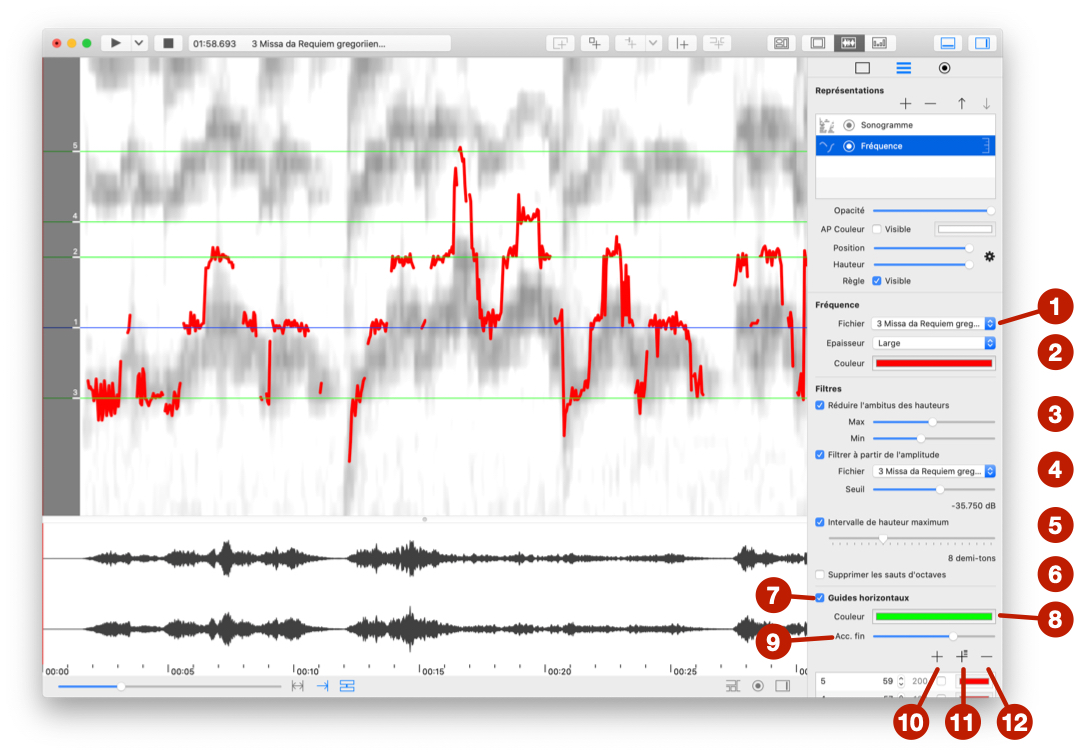
You can use this representation to visualize fundamental frequency estimation computed with the audio descriptor or imported from the Tony software.
See Compute descriptors to learn how to calculate audio descriptors.
See Import Tony Pitch Track Data files for more details on importing from Tony.
Frequency visualisation only uses the first serie of each data.
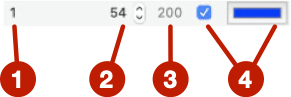
File: Select the data file.Width and Color: Select size and color of the drawing.Filters > Reduce pitch range: Change range of the drawing with Min and Max parameters.Filters > Filter from amplitude: Use an audio File to remove values under an amplitude value (Threshold).Filters > Maximum pitch interval: Remove values from interval above the semitone parameter.Filters > Delete octave jumps: Octave corrections.Horizontal guides to add horizontal lines that correspond to pitches.Color to change global color of lines. Each line can also have a custom color (see below).Fine tune to move all lines +/- 100 cents (see below for cents definition).+ to add a line.+ to add several lines computed from the most frequent frequencies.- to delete selected line in the table.Each line of the table contains:
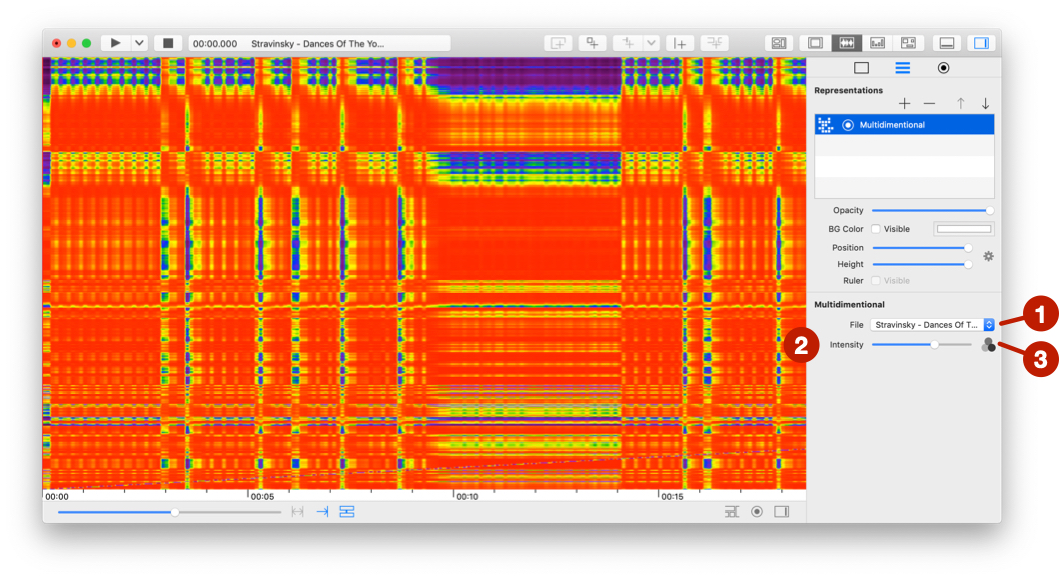
File to select an audio or video file (see also Advanced file menu at the bottom of this page).Intensity: Change intensity of colors.Advanced colors at the bottom of this page.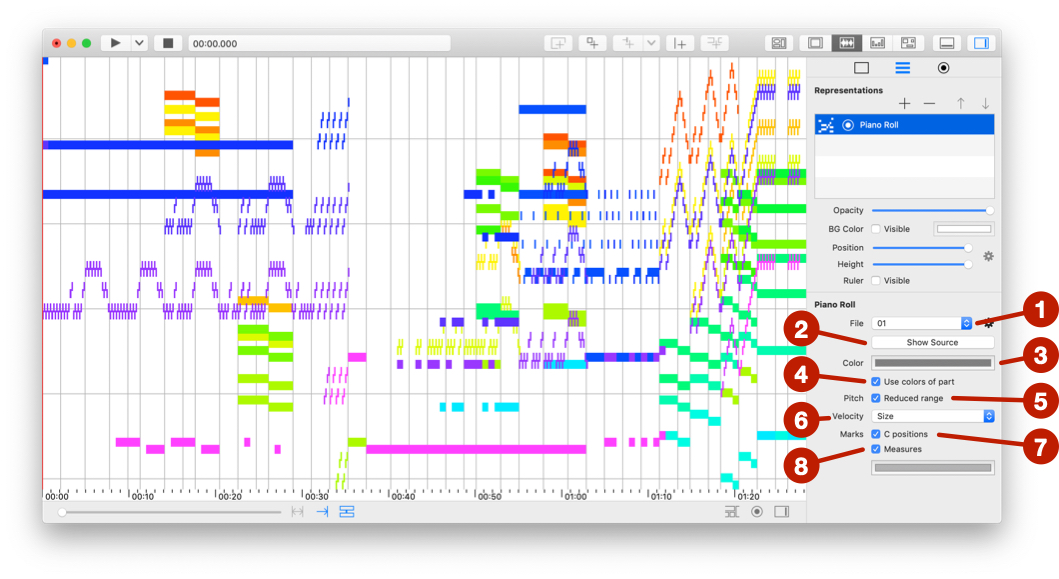
file to select a score file (see also Advanced file menu at the bottom of this page).Show source.Color of score.Use color of part. These colors are specified in the advanced menu (see Advanced file menu at the bottom of this page).Reduced range shows a focused score from low to high note.Velocity is displayed.C positions.Measures and select a Color.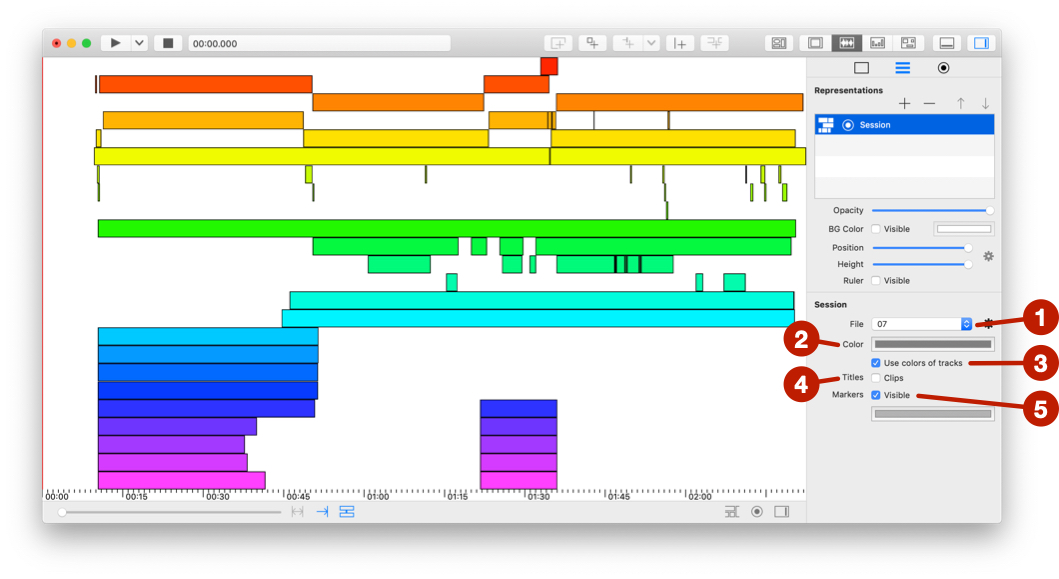
file to select a session file (see also Advanced file menu at the bottom of this page).Color of all clips.Use color of tracks. These colors are specified in the advanced menu (see Advanced file menu at the bottom of this page).Titles of clips.Markers and select a Color.Depending on the representation, you can access one or both of the following advanced functions.
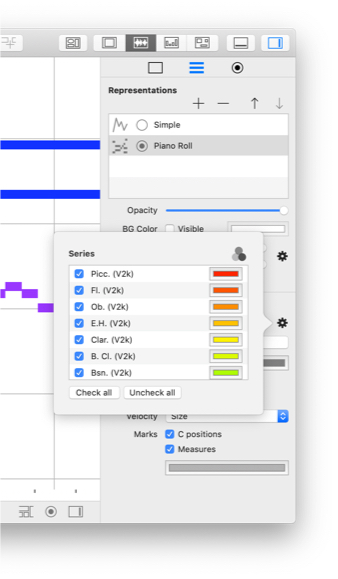
This window lists the series of the data file. You can show/hide series and change their display colors.
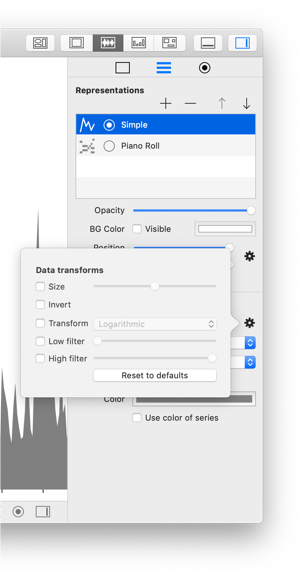
This window allows you to apply effects to the data.
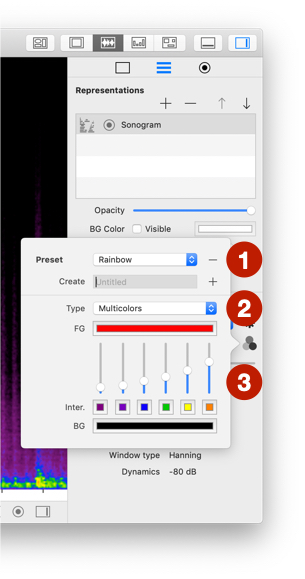
This window allows you to change the colors of sonogram and multidimentional representations:
To save setting:
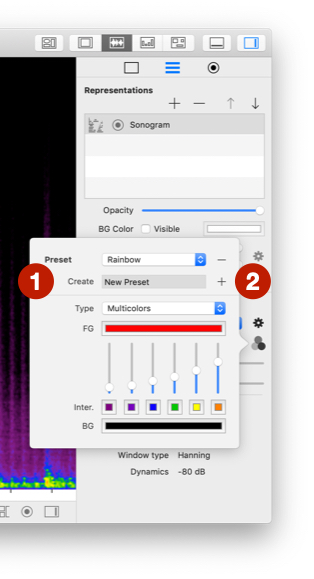
+.To delete a preset:
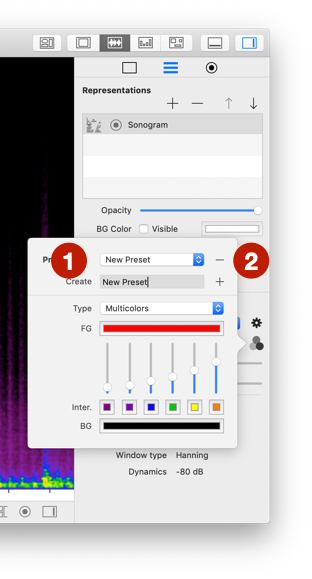
-.